
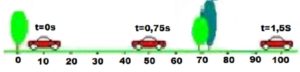
 The figure shows the axis of the traveled path and the value of time in seconds.

 During the movement of cars we measure the length of the road (distance) and the time of movement.
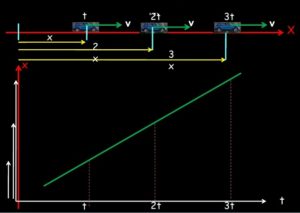
When we apply the time expressed in seconds to the horizontal axis of the coordinate system, and traveled path in meters to the vertical axis, we get a graph of the distance as a function the time, (es-te) s-t diagram. Specific values of time have specific values of distance. Both are inserted into the table (example of the table is shown below the graph). We transfer the points from the table to the graph and connect them with line.
For each value of time we construct an appropriate point on the graph. When we connect them, we get a line that represents a graph of the path of uniform movement. The angle that covers the graph with the positive part of the horizontal axis is greater if the cars moves at a higher speed. The speed is calculated by the given relation for the velocity
v = s / t
In the picture, the blue on the graph shows the velocity as a function of the time, v – t diagram. At any moment the movement in the uniform motion of the velocity is the same, constant. The speed in the first second is 66.66 m / s, in the second 66.66 m / s, the third and fourth 66.66 m / s.
When we apply these points to a graph and connect them, we get the line which is the parallel to the axis of time. That means that the speed in uniform motion is the same at any time.
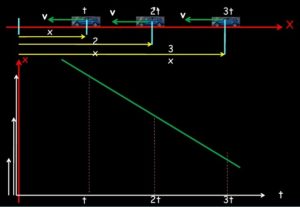
The smallest white arrow in the image indicates the initial position, and the longest end indicates the final position of the body. On the other graph, the body returns to the starting position, the graph of the distance decreases.
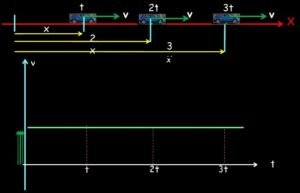
The figure shows the velocity graph for the same movement during t, 2t, 3t, the velocity does not change, the graph of the velocity is parallel with the time axis.

")


")
